in the United Kingdom and Denmark
On 19 December 2012 the Renewable Energy Foundation (REF, http://www.ref.org.uk/) published a new study on wind farm performance in The UK and Denmark. The study was made by Dr. Gordon Hughes who is a Professor of Economics at the University of Edinburgh.
The study is based on advanced statistical methods. Among its main findings are the following:
- The normalised load factor for UK onshore wind farms declines from about 24% at age 1 to 15% at the age 15.
- The normalised load factor for Danish onshore wind farms declines from 22% at age 1 to 18% at the age 15 (about 1.4% decline per year).
- The normalised load factor for Danish offshore wind farms declines from 39% at age 0 to 15% at the age 10.
These results have important implications for the economic evaluation of the wind power policy.
The capacity factor degradation was discussed at this site in a previous note. In contrast to Professor Huges I found that the variations in output from Danish wind farms followed the average wind variations closely. The impact of tear and wear seemed to be insignificant.
This note tries to explain why so different conclusions can be drawn from the same data.
Different approaches
My observations included 3,215 onshore turbines which were installed between 1992 and 2001 and which still existed at the end of 2011. They were divided into ten clusters. All turbines within a cluster have the same year of installation and belong to the same technological generation. Each cluster was analysed separately. The number of units in each cluster is between 97 and 731.
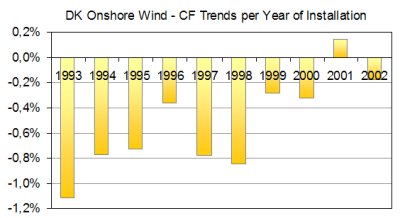
The average slope, weighted with the number of turbines, is -0.40%. Based on installed capacity the weighted average is -0.32%. This is due to larger turbines and more modest slopes for the last years.
It was my conclusion that both wind farm output and the average wind declined about 0.5% per year during these years and that no other significant influence on the performance could be verified.
My method has the problem that all turbines in the first cluster were 19 years old at the end of 2011 while the turbines in the last cluster were only 9 years old. The larger declines for the old turbines could indicate a deterioration which has consequences first after several years. On the other hand, the first four clusters are rather small (about 100) while each year from 1996 to 2000 represents between 400 and 700 turbines.
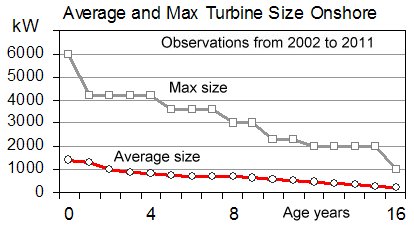
Professor Hughes' report is based on monthly productions for the years 2002 to 2011. The production data are arranged after the wind turbine age. An attempt to replicate the results of Professor Hughes based on my yearly data gave the following result:
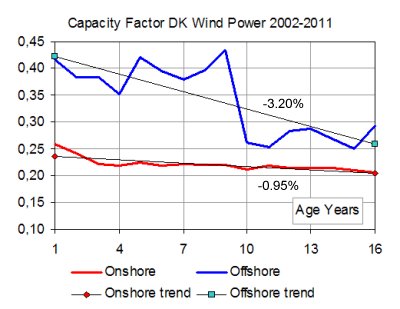
The average decline for onshore wind turbines is rather 1% per year than 0.5% on this chart. The main reasons for the difference are that the observations for a certain age include turbines of different sizes and technologies and particularly that the sample of one year old turbines is very different from the sample of 16 years old turbines.
Insufficient offshore observations
The steep decline for offshore turbines looks alarming and cannot be found in clusters with the same year of installation. In this case the approach has a systematic flaw. The first Danish offshore wind turbines were installed in protected waters where wind conditions are different from wind conditions on the high seas. There is a considerable difference between the capacity factors which can be achieved on the North Sea and in internal Danish waters. Therefore these two categories should not be analysed together.
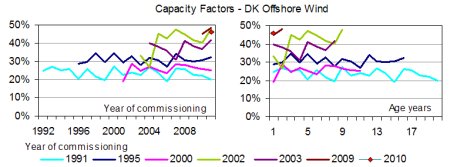
Besides, the number of Danish offshore observations is still quite low. It wil take several years before sufficient data is available for statistical analyses.
Monthly observations published by REF
In order to come even closer to the results of Professor Hughes I made the same calculation on the monthly data which REF published together with the report. The observations for each wind turbine include the month after commissioning until the month before decommissioning. The results are still organised after age with the year of commissioning as year 0.
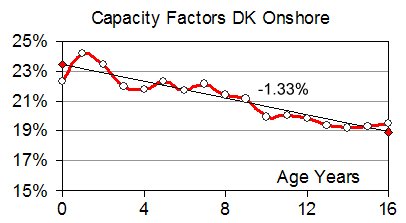
The statistical tools for normalising the data have not been available, but the trend has come quite close to the 1.4% decline per year found by Professor Hughes.
The monthly observations from the year of commissioning (year 0) and from the year of decommissioning have an influence on the results. One possible explanation could be that decommissioning in some cases could be the result of a period with poor or no performance.
Will the decline in output per year be 0.5% or 1.5%?
The difference can be decisive in the economic evaluation of wind energy projects.
Seventeen samples are created by arranging the observations for the years 2002 to 2011 after turbine age up to 16 years. The basic condition for using these samples for statistical purposes is that the samples are comparable apart from the age.
It is debatable if this condition is met here.
Statistical analyses cannot tell the future. As also emphasized by Professor Hughes the future wind turbine performance will depend on the rate of technological changes and on the future maintenance policy. Fast technological changes and insufficient maintenance may cause poor performance irrespective of what happened in the past.
See the report here