Data and Transparency
| 4 March 2017: | |
|
Evaluation of Deficiences in Data from ENTSO-E
After having noticed some deficiencies in data from the ENTSO-E Transparence Platform (ETP) I wanted to know more about the data quality. I compared eight time series from ETP with later data from the system operators for France (2015) and Sweden (2016). See the results in this note
|
| 22 February 2017: |
|
Time Series for the Year 2016 Uploaded
It was my intention to end the preparation of time series for European power systems with 2015, but the ENTSO-E time series for 2016 proved to be defective. I downloaded and completed certain data for my own use and decided to make these data available to users of my homepage. My introduction also includes a guide for download of data from the Transparency Platform. Link to Download Section.
|
| 16 December 2016: |  |
|
Better Data Soures for European Power System Analyses
I have collected hourly time series for a number of years. Better data sources than the collection on this site are now available, and I can with a clear conscience stop collecting more time series. I am happy to see the need for such data widely acknowleged, and I would like to thank the foreign colleagues who have contributed to the collection.
|
| 25 February 2016: |  |
|
Short Statistics
Most countries are transforming their electricity supply systems by installing more wind and solar power. These technologies are fluctuating and non-dispatchable. Essential characteristics of the power systems are changing. I have added a new section with short statistics to this homepage in order to identify some trends during the course of change.Until now, the statistics include European quarterly wholesale prices and a selection of Danish trends. |
| 30 January 2016: | |
|
Will Germany Meet its CO2 Target in 2020?
| |
| 29 January 2016: |
|
ENTSO-E's Transparency Platform: The Future Source of European Market Data
The Transparency Platform (TP) opened formally on 5 January 2015. Since then, TP collected and published time series with electricity market data for EU countries. So far, the 2015 data are incomplete for several countries. Therefore, 2015 data from the traditional sources will also be collected and presented in the download section of this web site. The source will appear on the top of each sheet.
Visit the Transparency Platform and my download section
|
| 21 January 2016: | 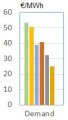 |
|
Records and Trends in Danish Electricity Industry
From 2010 to 2015 the production of wind energy in Denmark increased from 20% to 40% of the electricity consumption and the spotmarket prices were falling to about half the level in 2010.
In 2015, the balancing of the non-controllable Danish power sources was still made abroad. Will these trends continue until 2020? |
| 19 December 2014: | |
New Data in the Download Section
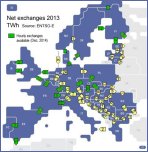
Thanks to interested members of the Energy Group under European Physical Society (EPS) it has been possible to add hourly 2013 time series for the Czech Republic, Finland and Spain to the data collection. Besides exchange data by country or by interconnetor was added for Denmark, Finland, the Czech Republic, Great Britain, France and Spain. Unfortunately, complete exchange data for Germany are still missing. See the download section.
Click map to see where hourly exchanges are available (green arrows). |
|
| 13 December 2014: | |
|
Energinet.dk Must Publish Future Critical Grid Events
A new 196 pages report outlines a new regulation for the Danish electricity sector. Essential elements are better planning and information on security of supply.
See my comment.
|
|
| 14 November 2014: | |
|
Call for a New European Database on Operational Data
My collection of data in the download section was supposed to demonstrate the possible applications of a simple database with uniform data from several countries. I think that it is about time to evaluate the experiences so far and to develop a new and better database.
See my presentation for the Energy Group Meeting of the European Physical Society.
|
|
| 28 March 2014: | |
|
Statistical Survey 2013
with wind power data for 7 European countries is now available here.
|
|
| 28 November 2013: | |
|
Belgian Data Added to Download Section
Thanks to Hubert Flocard it is now possible to download Belgian load data and wind power data, including separate time series for onshore and offshore wind.See the download section
|
|
| 6 September 2013: | |
|
Onshore and Offshore Wind Data also Available for 2011
Energinet.dk has informed me that also separate onshore and offshore wind power outputs for 2011 are available. 2011 is considered to be a very normal wind power year.
The new time series have been added to my download centre. |
|
| 2 September 2013: | |
|
Separate Onshore and Offshore Wind Data Now Available
Energinet.dk has started the publication of separate hourly time series for Danish onshore and offshore wind.
The time series for 2012 and 2013 are available from my download centre. Time series for photovoltaics (PV) are supposed to follow soon. |
|
| 6 June 2013: | |
|
Poor Transparency at Bundesnetzagentur
The German Bundesnetzagentur prepares a report on the grid condition for the Federal Ministry of Economics and Technology every two weeks. For inscrutable reasons the reports are secret.
Read more here
|
|
| 31 March 2013: | |
|
Statistical Survey 2012
Observations for 2012:- The main flow of electricity in Europe was from north to south - Very low Nordic and German spot prices - Closely related spot prices in Denmark and Germany - Record low thermal production in Denmark - Wind power performance analysed for 6 European countries Read more in the Statistical Survey 2012
|
|
| 20 October 2012: | |
|
Data Collection Updated with 3rd Quarter 2012
From 2012 the collection of hourly time series includes wind power output and other relevant data from Denmark, Germany, Republic of Ireland, Great Britain, France and Spain.
Download data here
|
|
| 9 May 2012: | |
|
Grid Performance Report from the German Grid Agency
The German Federal Grid Agency has issued a report on the supply situation for electricity and gas during the winter season 2011/12. Such reports are informative, but unfortunately rare.
Here is my translation of the summary and here is the full report (in German) |
|
| 15 April 2012: | |
|
Download British System Prices
British system prices for 2009, 2010 and 2011 are now available on the download page. The new data includes System Sell Price (SSP) and System Buy Price (SBP) in £/MWh (average values per hour).
|
|
| 9 February 2012: | |
|
Wind Power and Spot Markets in 2011
Observations for 2011:- A wet summer and a German nuclear moratorium tilted the energy balance - The new balance reversed the electricity transit in Denmark - Denmark and Germany is a common market block with 9% wind energy - Temporary capacity cuts limits the access to cross border trade - Aggregated wind power from 5 countries cannot create a smooth supply Read more in the Statistical Survey 2011
|
|
| 1st December 2011: | |
|
New types of data ready for download
 The download section is currently being extended. The download section is currently being extended.
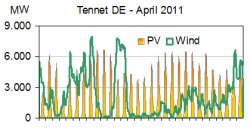
Time series on Photovoltaic (PV) production and offshore wind are now available. PV has gained a significant volume in Germany and it is increasingly important to understand the different variabilities of PV an wind power. Find the data in the download section. |
|
TABLE BORDER="0">
Time series for internaional comparisons
Collecting time series for international comparisons of wind power integrations can be quite problematic.
A selection of the time series used in my analyses is availale here.
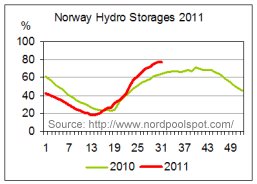 The water level in the Norwegian hydro storages is now close to be normal for this time of the year.
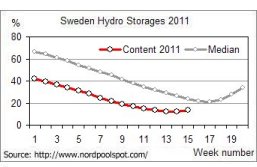 The water level is very low in the Norwegian and Swedish hydro storages this year. The cause is an increasing consumption of electricity and a low inflow of water in 2010.
 Wind power integration is an important issue in the UK. As a contribution to the debate Renewable Energy Foundation (REF) has puiblished a book with five of my recent papers.